
Endocrine Excerpts and Graphs
Excerpt Instructions
Practice your reading skills on each of the excerpts. Then pull out all content ideas from the excerpt and recall ideas associated with each ensuring you try to create one large recall with connections between as many ideas as possible. After reading and recalling watch my attempt and compare it to your own. If you notice content ideas you missed or mistakes you made correct those and make sure you can see why I pulled those ideas out.
Thyroid-Associated Opthalmopathy
Thyroid-associated ophthalmopathy (TAO) is an autoimmune disease of the orbit involving infiltration of inflammatory cells and proliferation of orbital fibroblasts (OFs) leading to accumulation of the extracellular matrix (ECM) and hypertrophy of extraocular muscles and adipose tissue. OFs play key role in the development of TAO because they express thyroid stimulating hormone receptor (TSHR), which is targeted by thyroid-stimulating immunoglobulin (TSI), thus triggering inflammation. In addition to TSI, insulin-like growth factor-1 (IGF-1) is also an important player in the development of TAO. Local production of IGF-1 by OFs is implicated in the growth of OFs, in an autocrine or paracrine manner.
Octreotide, a synthetic octapeptide that pharmacologically mimics natural somatostatin (SST), is known to decrease the secretion of growth hormone (GH) and IGF-1 in patients with acromegaly. Thus, octreotide is used for the treatment of GH/IGF-1-related diseases, such as acromegaly, TSH-secreting pituitary adenomas, and gastro-entero and pancreatic neuroendocrine tumor. Treatment with 1,000 nM octreotide could neutralize the increase in IGF-1 mRNA level and significantly reduce the proliferation of cultured OFs by 75% in patients with TAO.
Adapted from: Kim SE, Kim J, Lee J-Y, Lee S-B, Paik J-S, Yang S-W (2021) Octreotide inhibits secretion of IGF-1 from orbital fibroblasts in patients with thyroid-associated ophthalmopathy via inhibition of the NF-κB pathway. PLoS ONE
Graph Instructions
For each of the graphs displayed below first identify any content ideas you can and recall as much about those ideas as possible. Then free interpret each graph. Once you are done watch my walkthrough and compare it to your own.
Graph 1
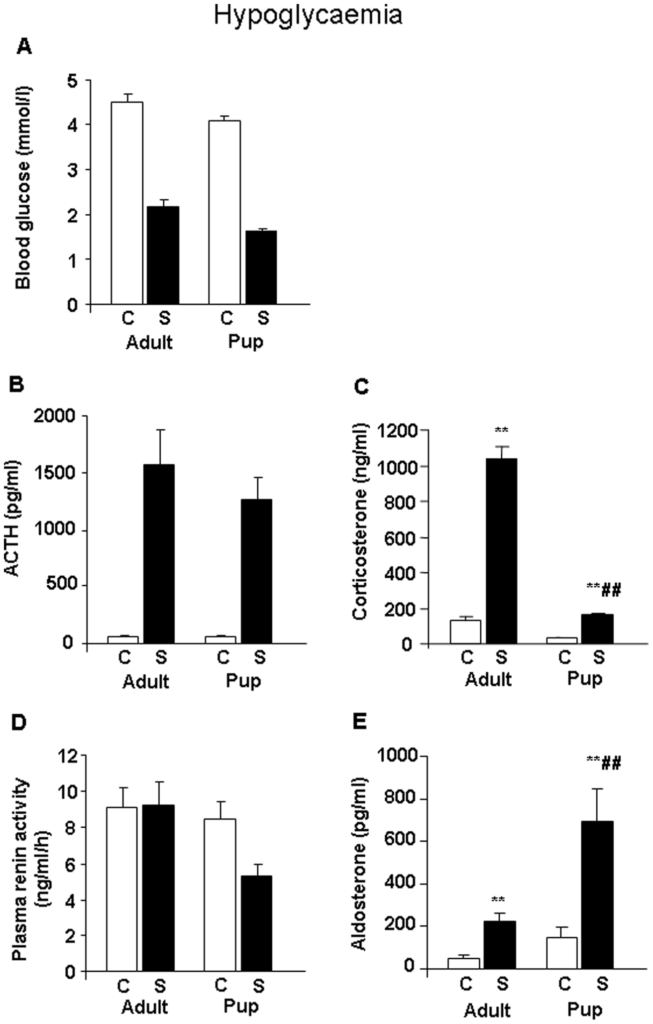
Figure 1: Levels of blood glucose, ACTH, corticosterone, renin, and aldosterone in 12-day old rat pups and adult rats exposed to hypoglycemic stress (S) or an unstressed control condition (C).
Adapted from: Varga J, Ferenczi S, Kovács KJ, Garafova A, Jezova D, Zelena D (2013) Comparison of Stress-Induced Changes in Adults and Pups: Is Aldosterone the Main Adrenocortical Stress Hormone during the Perinatal Period in Rats? PLoS ONE